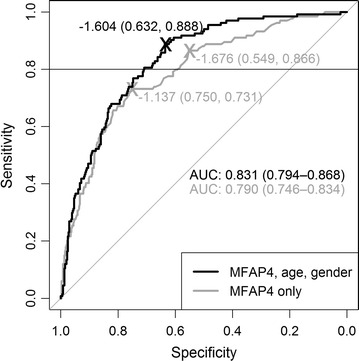
Fig. 2.

ROC curves based on univariate logistic regression model considering solely MFAP4 serum concentrations (grey line) and multivariate model considering also age and gender (black line), respectively. MFAP4 serum concentrations were measured in patients with different stages of hepatic fibrosis (F0–F4 according to Desmet-Scheuer-scoring system). The ROC curves represent the differentiation of mild to moderate (F0–F2) and severe fibrosis and cirrhosis stages (F3, F4). AUC values represent the area under the respective curves, values in brackets represent the 95 % confidence intervals. The given cutoffs are Youden-optimized with no restriction and within a sensitivity range of 0.8–1 indicated by the horizontal line on top of the graph, respectively. As the ROC curves represent the complete data set, corresponding diagnostic characteristics indicated at the optimal cutoffs are prone to overoptimism. Please refer to text for LOOCV results
