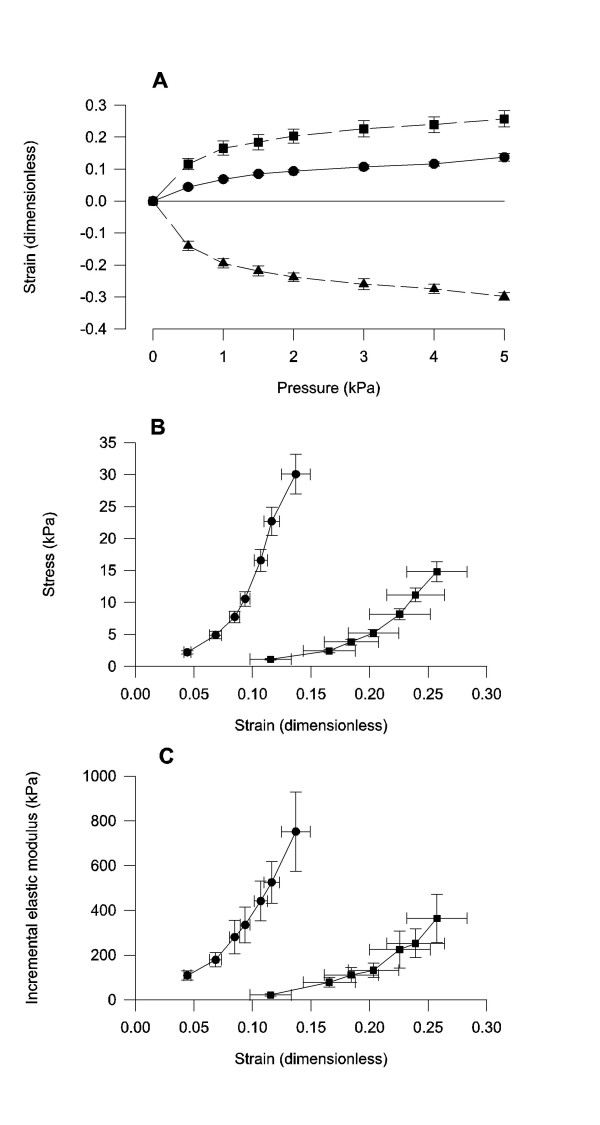
Figure 4.
Bile duct mechanical parameters. The strain-pressure data are from circumferential (circles), longitudinal (squares) and radial (triangles) directions. Note in the stress strain graph (B) and the elastic modulus graph (C) that the circumferential curves are shifted to the left of the longitudinal indicating that the bile duct is stiffest in circumferential direction. n = 10. Mean ± SEM is shown.

