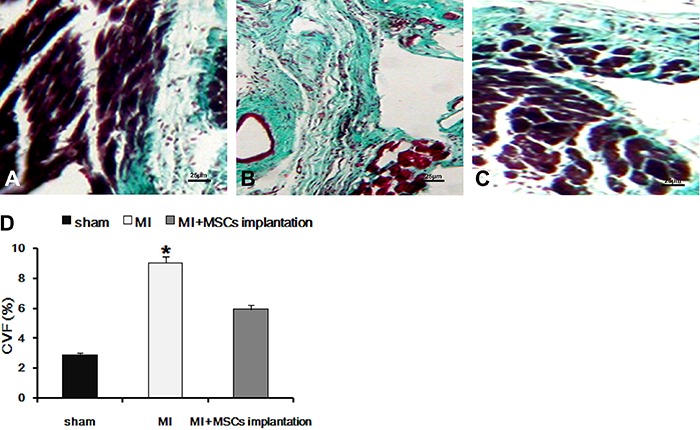
Figure 5. Masson staining results. A, sham operation group; B, after myocardial infarction, a scar area dyed green or blue appears in the control group; C, muscle cells dyed red can be observed between collagen fibers in the group that received myocardial implantation of mesenchymal stem cells (MSCs) in the infarcted heart; D, myocardial collagen volume fraction (CVF) of different groups. MI: myocardial infarction. Magnification bar: 25 μm. Data are reported as means±SD. *P<0.05 vs sham operation group (one-way ANOVA).

