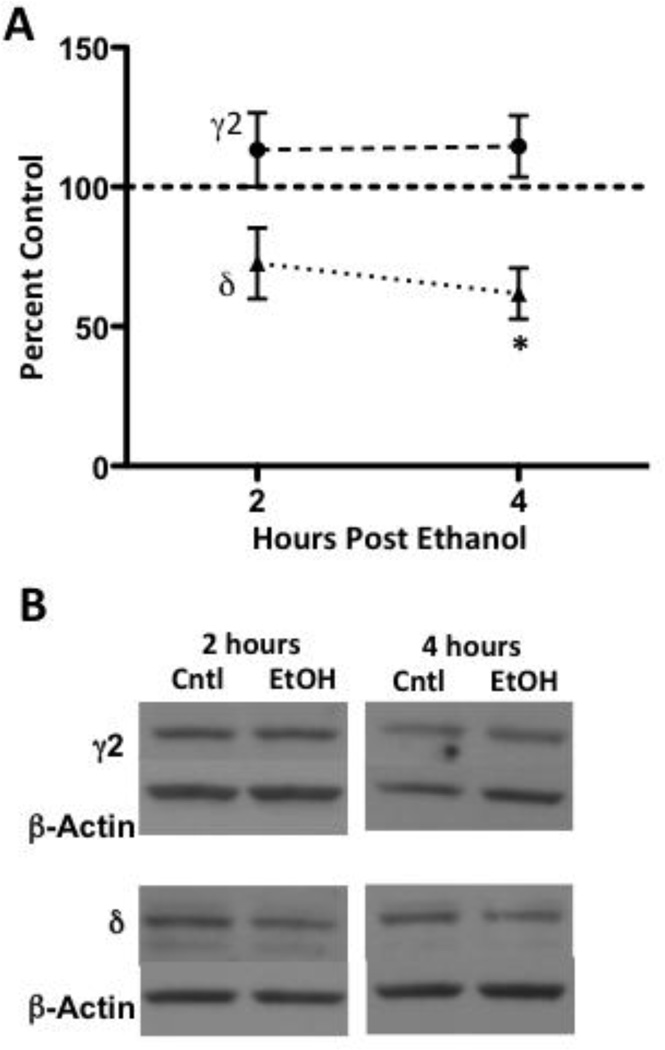
Figure 3. Acute ethanol administration reduces GABAA receptor δ subunit expression.
Graph denotes time course for GABAA receptor γ2 and δ subunit levels at time points related to changes in α4 subunit expression following ethanol administration (A). GABAA receptor δ subunit expression was decreased at 4 hours by 38.2 ± 9.2%, and a trend for a reduction was noted at 2 hours (27.4 ± 12.7%). Representative blots are shown for both subunits (B). Data are presented as mean ± SEM. n = 5–8 per group, in duplicate. * p < 0.05 compared to vehicle controls (Student’s t-test).

