Figure 5.
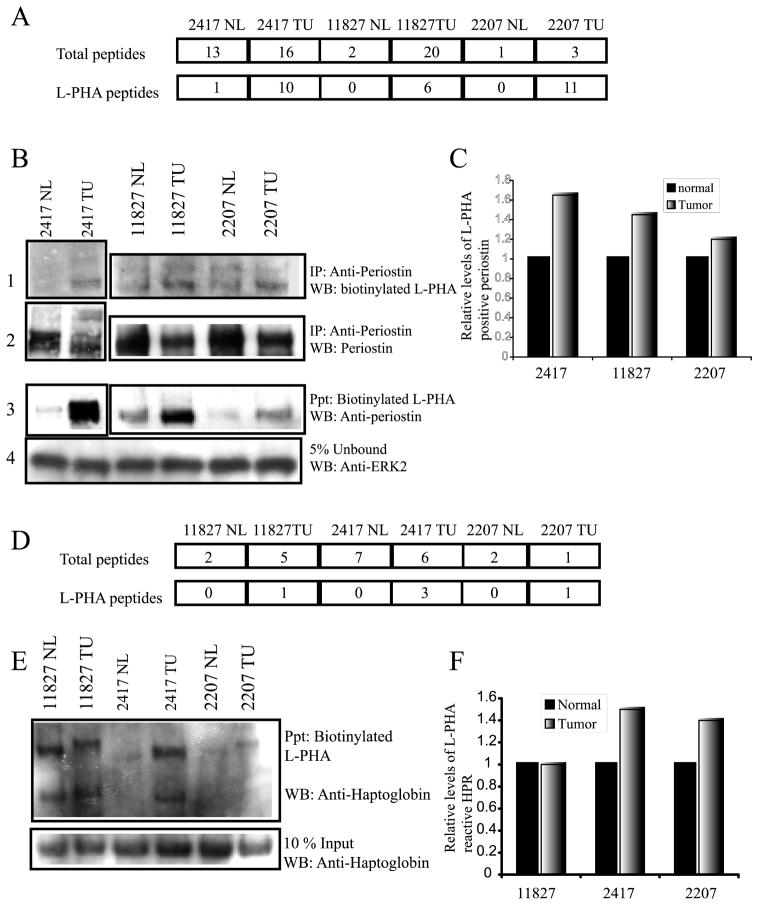
Analysis of periostin and haptoglobin-related protein or haptoglobin by Western blot. (A) Number of peptides identified for periostin (isoform 1 and isoform 3) before L-PHA fractionation (total) and after lectin fractionation (L-PHA). (B) Precipitation of periostin using an anti-periostin antibody followed by detection using biotinylated L-PHA and streptavidin HRP (panel 1) (lower band is periostin). Total levels of periostin precipitated are confirmed by detection of the blot using anti-periostin antibody (panel 2). Reverse precipitation with L-PHA first followed by detection using an anti-periostin antibody (panel 3). Protein inputs for the L-PHA precipitations were normalized by the detection of ERK2 in 5% of the unbound fraction (panel 4). (C) Densitometry quantification of the relative increase in L-PHA reactive periostin normalized for total periostin. (D) Number of peptides identified for haptoglobin-related protein (HPR) precursor and haptoglobin (HP) by MS/MS before (total) and after L-PHA fractionation (L-PHA). (E) L-PHA precipitation followed by detection using an anti-haptoglobin antibody shows increased reactivity for the beta chains of tumor HPR/HP for cases 2417 and 2207 and, in all cases, a migratory shift to a higher molecular weight. Protein levels present in the L-PHA precipitations were determined by analysis of total haptoglobin in a 10% input blot. (F) Levels of L-PHA reactive haptoglobin were determined following densitometry analysis of L-PHA reactive HPR/HP and total HPR/HP determined from the 10% input levels.

