
Figure 3.
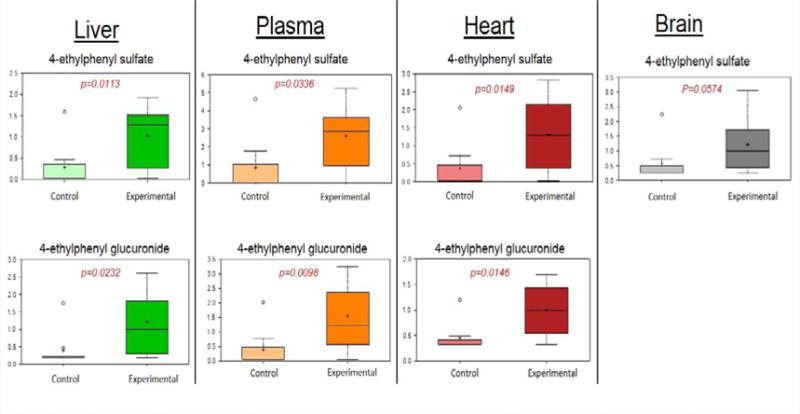
Levels of 4-EPS and 4-EPG in organs and plasma of experimental vs. control animals.
Data presented are mean±S.D. Welch’s two sample t-tests. N=9 animals per group. Experimental: oral application of Pg, control vehicle alone.
Official websites use .gov
A
.gov website belongs to an official
government organization in the United States.
Secure .gov websites use HTTPS
A lock (
) or https:// means you've safely
connected to the .gov website. Share sensitive
information only on official, secure websites.
Levels of 4-EPS and 4-EPG in organs and plasma of experimental vs. control animals.
Data presented are mean±S.D. Welch’s two sample t-tests. N=9 animals per group. Experimental: oral application of Pg, control vehicle alone.