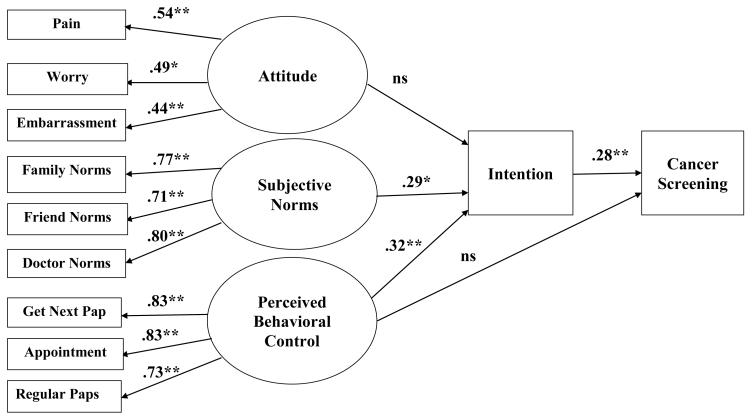
Figure 1.
Structural model of the TPB predicting cervical cancer screening among Latinas. Model fit indices: χ2 (48) = 54.32, p-value= .246; CFI= .992; RMSEA=.015 (.000, .032); WRMR= .069; Intention R2 = .28; Cancer Screening R2 = .13. The model also included Intervention group (i.e., control vs. intervention) as a covariate predicting Cancer Screening to control for its effects (.52, p <.001).
* p-values are significant at < .05; **p-values are significant at ≤ .001; ns= non-significant path

