
Figure 3.
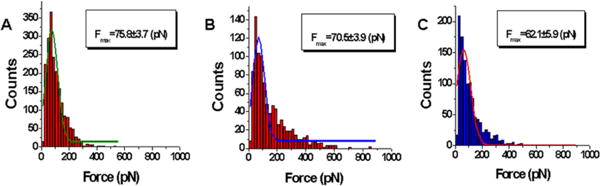
Quantitative analysis of the force spectroscopy data for rupture forces (F) obtained from probing events of specific and nonspecific sequences. Histograms for the rupture force distributions are approximations with a single Gaussian, and the parameters of the fit are shown in the boxes with the SEM indicated: (A) complex of A3A with specific sequence 1, (B) complex of A3A with specific sequence 2, and (C) complex of A3A with nonspecific sequence 3.