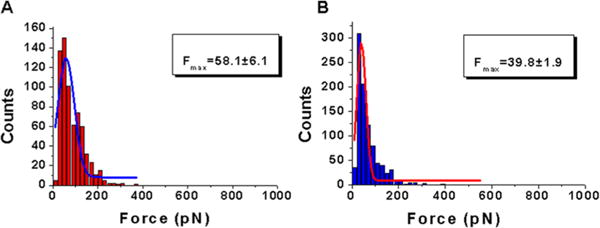
Figure 5.

Quantitative analysis of the force spectroscopy data for rupture forces (F) obtained from probing A3A-cys complexes interacting with specific and nonspecific sequences. Histograms for the rupture force distributions are approximations with a single Gaussian, and the parameters of the fit are shown in the boxes with the SEM indicated: complexes of A3A-cys with (A) specific sequence 2 and (B) nonspecific sequence 3.
