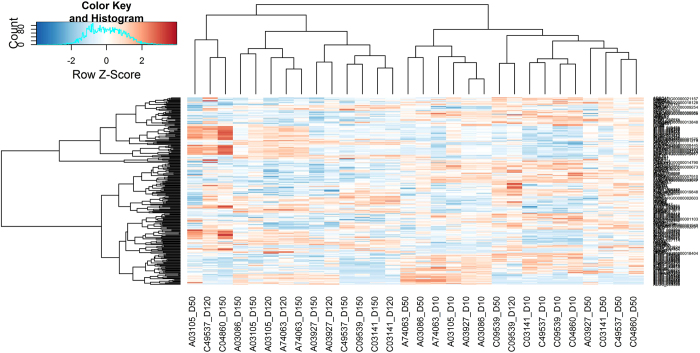
Figure 4. Heatmap and hierarchical clustering of the differentially expressed genes (DEGs) across lactation and between the Assaf and Churra sheep breeds.
Heatmap display of supervised hierarchical clustering of the DEGs identified across the four considered time points of the sheep lactation (D10, D50, D120, D150) and between both breeds. The genes are displayed in rows and the normalized counts per sample are displayed in columns. Each column represents a sample; sample names indicate the corresponding breed (A=Assaf; C=Churra) and day of sampling (D10, D50, D120, D150). A colour code indicates up-regulated (orange) and down-regulated (blue) expression levels.

