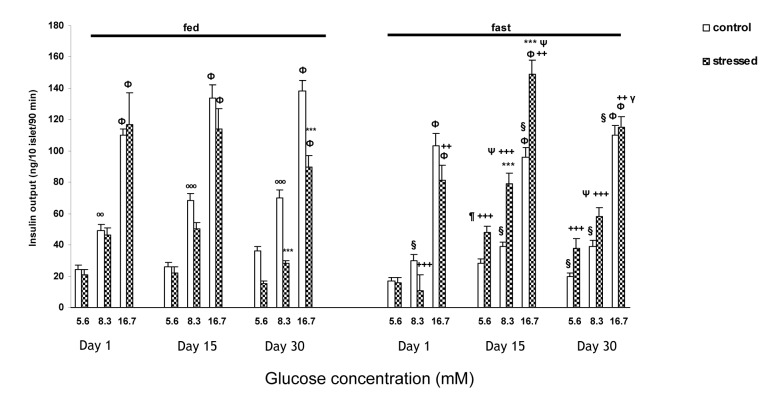
Figure 2. The insulin output (ng/10 islets/90 min) from pancreatic isolated islets in response to different glucose concentrations following acute (one day) and chronic [(15 days) and (30 days)] exposure to psychological stress in fed and fasted states.
Values are Mean ± SEM of 4 rats (5 groups of 10 islets each/glucose concentration/rat).
ФP<0.001, significant difference versus both 5.6 and 8.3 mM glucose concentration of the same group. ºººP<0.001, ººP<0.01, significant difference versus 5.6 mM glucose concentration of the same group. ***P<0.001, significant difference versus control group of the same group. ΨP<0.001, ¶P<0.01, significant difference versus day 1 of the same group. γP<0.001, significant difference versus day 15 of the same group. §P<0.001, significant difference versus fed control group. +++P<0.001, ++P<0.01, significant difference versus fed stressed group

