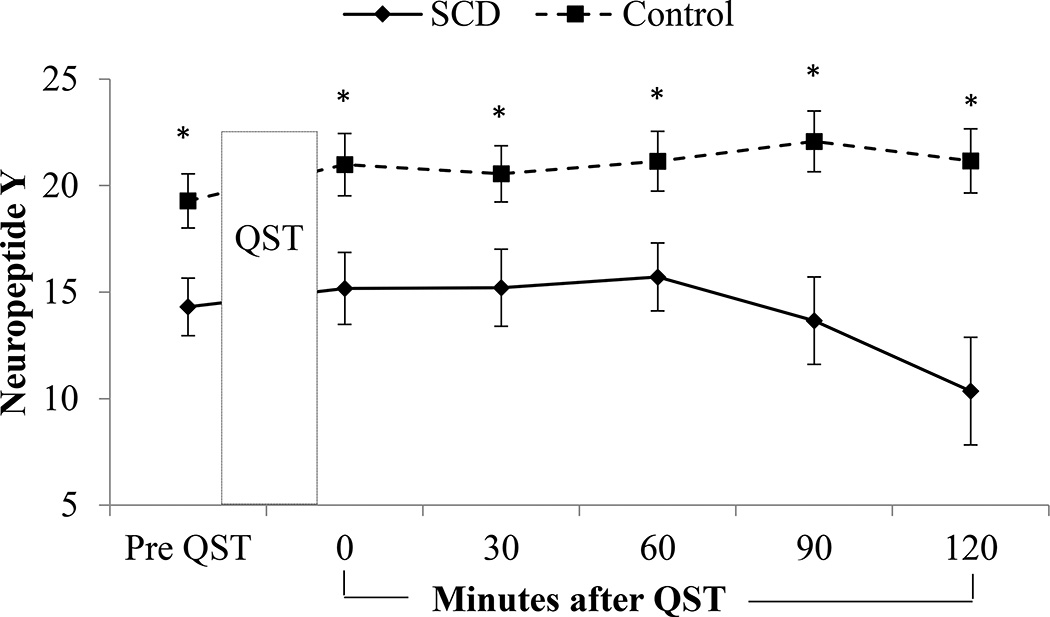
Figure 2.
NPY reactivity by group. Main effects of group and time as well as a group by time interaction was observed for NPY (group p=0.04, time p<0.001, interaction p<0.001), with healthy controls having higher levels overall and a slight increase over time, while the SCD patient subgroup had a five-point reduction in NPY over the final hour of testing. Significant differences between groups were also observed at each time point.

