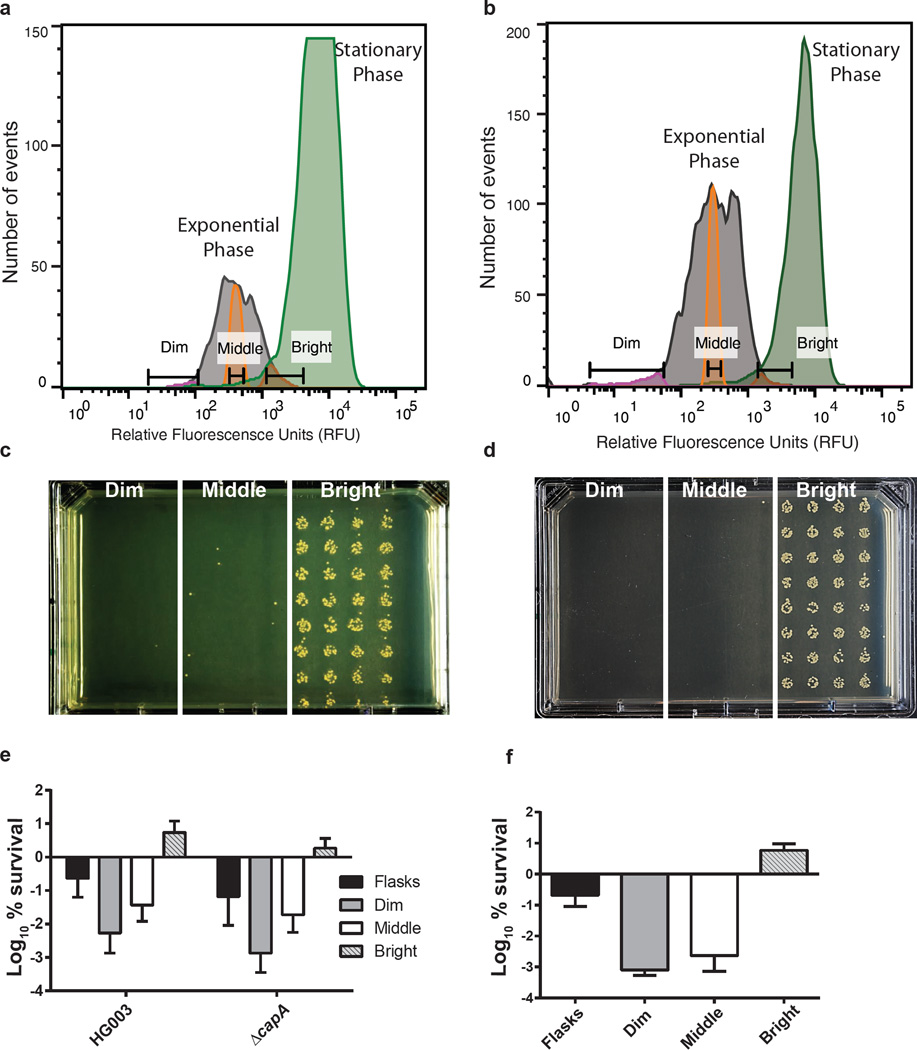
Figure 3. Persister sorting using stationary markers Pcap5A and ParcA.
Expression of a, Pcap5A::gfp or b, ParcA::gfp in exponential following ciprofloxacin challenge (grey peak) and stationary phase (green peak) measured by FACS. Exponential phase cells were gated into 3 populations depending on expression of GFP - dim (pink peak), middle (orange peak) or bright (red peak - cells expressing stationary phase levels of reporter in exponential phase). (c,d) Cells were sorted based on dim, middle or bright GFP expression onto MHA plates at 1000 events/spot for both Pcap5A::gfp and ParcA::gfp. Representative plates are shown. Survivors from each population of HG003 or Δcap5A harboring e, Pcap5A::gfp and f, ParcA::gfp were counted following incubation overnight at 37°C. The asterisks indicate statistical significance between middle and bright populations, determined using Student’s t-test (P ** < 0.005 or P***<0.0005). All experiments were performed in biological triplicates. SD are indicated. a, b, c, d are representative of one replicate.

