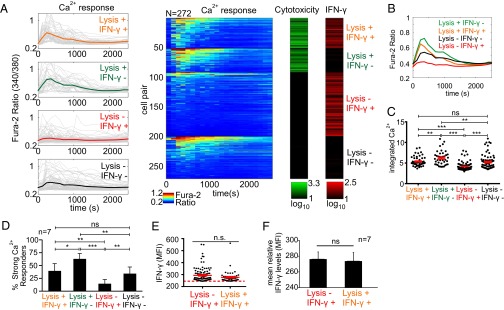
Fig. 5.
Comparison of Ca2+ responses of cytokine primed (IL-12, IL-18) NK92MI cells within different effector response groups. (A) Clustering of response profiles into four functional groups. Lysis+ indicates cytolytic activity, IFN-γ+ indicates cytokine production. Time plots displaying Ca2+ profiles are shown to the left. Each gray trace represents the response of a single NK92MI cell, and color-coded bold traces show group averages. Corresponding Ca2+ heat maps are shown to the right (jet colormap), each row corresponding to an individual cell. Cytotoxicity and IFN-γ production displayed as green and red colormaps, respectively. Range for each colormap displayed below corresponding colormap. (B) Comparison of average Ca2+ traces of the functional groups. (C) Comparison of integrated Ca2+ levels among the functional groups. Each dot represents single-cell data. Solid red lines represent mean ± SEM of corresponding data points. **P < 0.01, ***P < 0.001; n.s., not significant, one-way ANOVA with Tukey’s posttest. (D) Comparison of the strong Ca2+ responder percentages within each functional group. *P < 0.05, **P < 0.01, ***P < 0.001; n.s., not significant, repeated-measures one-way ANOVA with Tukey’s posttest. (E) Comparison of single-cell relative IFN-γ levels (MFI) between Lysis− IFN-γ+ and Lysis+ IFN-γ+ groups. Red dashed line represents the threshold for positive cytokine production events. Solid red lines represent mean ± SEM of corresponding data points. Only IFN-γ positive events are shown. Each dot represents single-cell data. n.s., not significant, Mann–Whitney test. (F) Comparison of mean relative IFN-γ levels between Lysis− IFN-γ+ and Lysis+ IFN-γ+ groups. n.s., not significant, Student’s t test. (A–C, E) Results are representative of seven independent experiments. (D and F) Results are from seven independent experiments.

