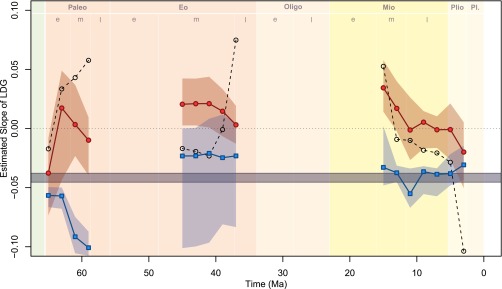
Fig. 2.
The mammalian LDG in North America throughout the Cenozoic. LDG is quantified as the slope of the linear regression of the natural logarithm of species richness on latitude (degrees north of the equator). Points indicate the median slopes calculated within each 2-My interval, and the surrounding shading comprises the 95% CIs of slopes from the successful pseudoreplicate analyses (Materials and Methods). Red circles indicate sample-standardized estimates from the fossil record, and blue squares indicate the adjusted modern slope, estimated from extant species but constrained by the geographic distribution of fossil collections within that interval (Materials and Methods). The dashed line and open circles indicate the face-value (i.e., unstandardized) fossil LDG slopes. The horizontal gray bar shows the range of face-value estimates of the modern LDG slope when calculated using a range of latitudinal band widths (Materials and Methods).

