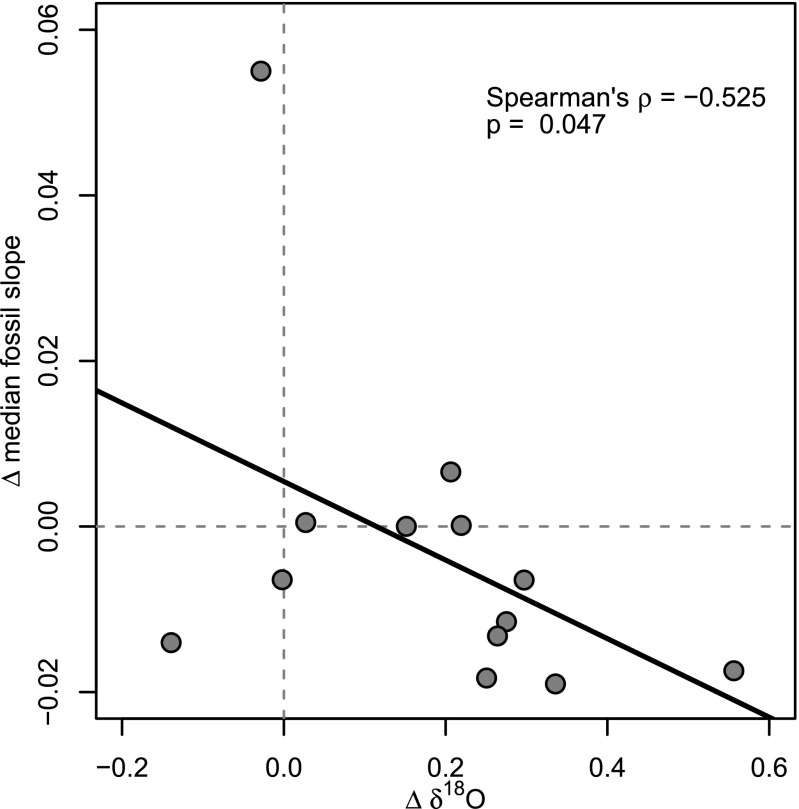
Fig. 3.
Relationship between mean global temperature and the slope of the fossil LDG. Points represent changes between subsequent time intervals (i.e., first-differences) of mean oxygen isotope values [data are from Zachos et al. (25)] versus median slopes of the LDG using fossil data. The heavy black line represents least-squares linear regression.

