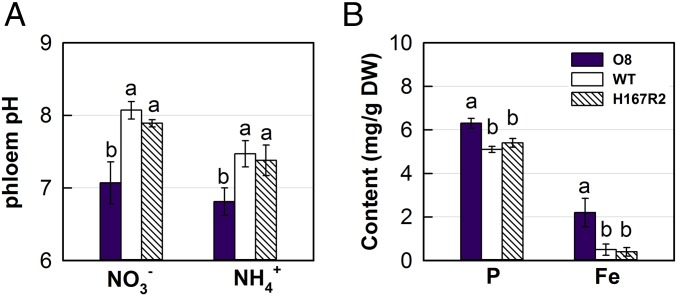
Fig. 5.
Effects of OsNRT2.3b and H167R overexpression on phloem pH and P and Fe content. (A) Phloem pH under 2.5 mM [supplied as Ca(NO3)2] or (supplied as NH4Cl). (B) Total P and Fe content in leaves measured by ion chromatography analysis. Values are mean ± SE (n = 5). a, b, and c above bars indicate significant differences (P < 0.05) between the transgenic lines and WT estimated by one-way ANOVA.

