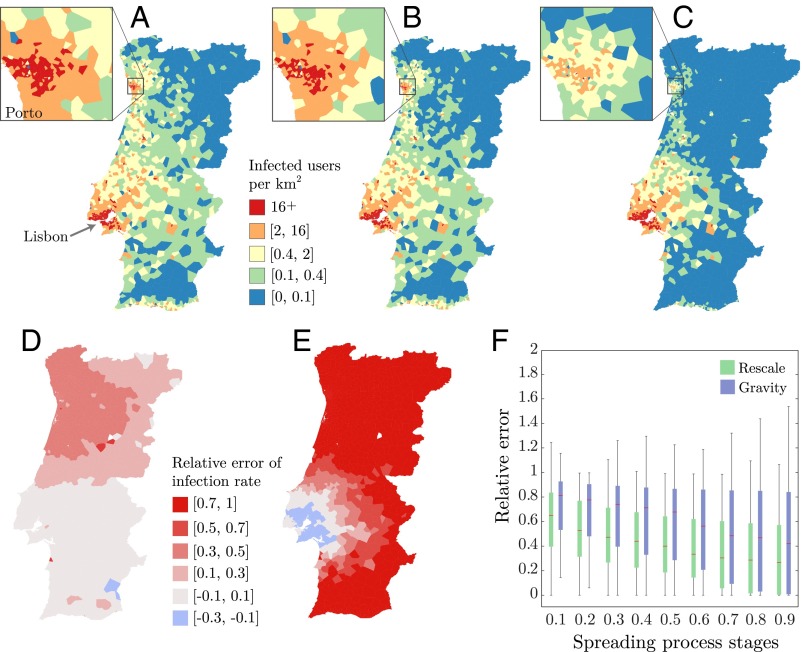
Fig. 5.
Epidemic spreading simulations in Portugal. Densities of infected users at time following a simulation of an SIS spreading process (, ) originated from Lisbon by using (A) real mobility fluxes , (B) the rescaled social fluxes , and (C) the mobility fluxes approximated by gravity model . (D) Relative errors of infection rate (Eq. S19) and (E) (Eq. S20) at each location i at time . (F) Distributions of mean relative error (green) and (blue) over 500 SIS simulations at different stages before reaching the steady state, documenting the superior predictive power of our method comparing with gravity model at all stages of the spreading processes.

