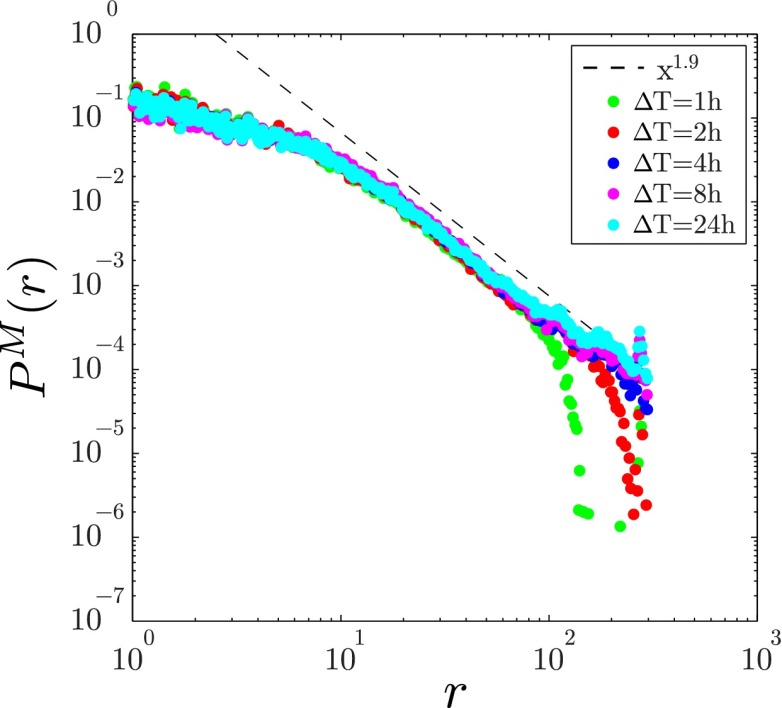
Fig. S1.
Jump size distribution for interevent time h for the dataset. A power law with exponent provides a guide to the eye. We observe that the curves are bounded by the maximum distance a user can travel during their corresponding interevent time for or the maximum distance enforce by geographical constraints in that country.

