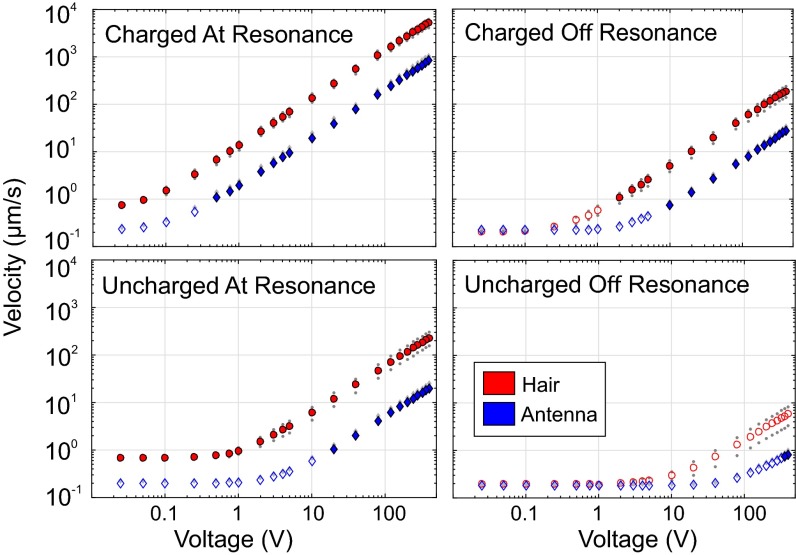
Fig. 3.
Antenna (blue) and hair (red) mean velocity in response to oscillating electric fields at the resonant frequency of each structure (Left) and at the frequency of median response (Right) under charged (Top) and uncharged (Bottom) preparations. Gray dots show SEM. Filled shapes denote responses that were significantly larger than thermal noise. Unfilled shapes denote responses statistically indistinguishable from thermal noise.

