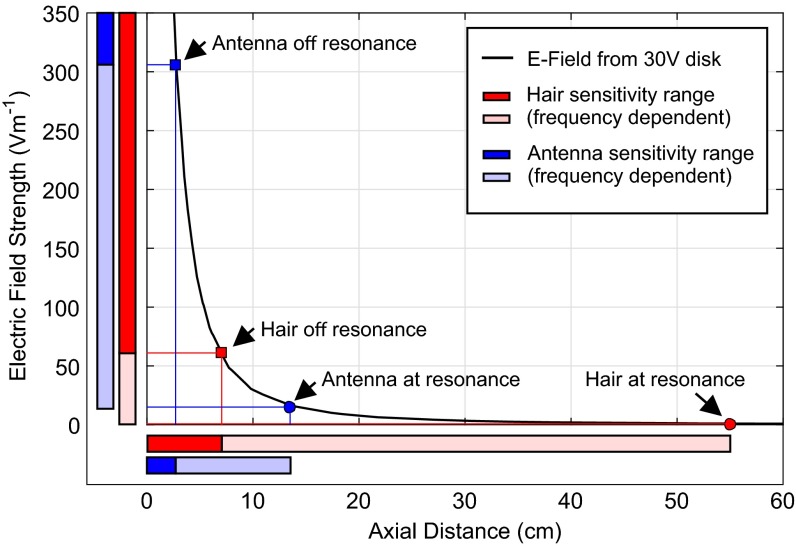
Fig. 5.
A finite element model of the stimulus delivery system showing electric field strength as a function of axial distance from 30-mm steel disk held at 30 V. The labeled points show the maximum distance of detection calculated for hairs (red) and antennae (blue) for resonant stimuli (circles) and nonresonant stimuli (squares). The bars on each axis represent the range of values of electric field and distance at which these structures show a mechanical response. The lighter area shows the difference between at-resonant and off-resonant stimulation, showing the responses within this range depend on frequency. The dark colored areas of the bars show the range at which the structures respond at all frequencies.

