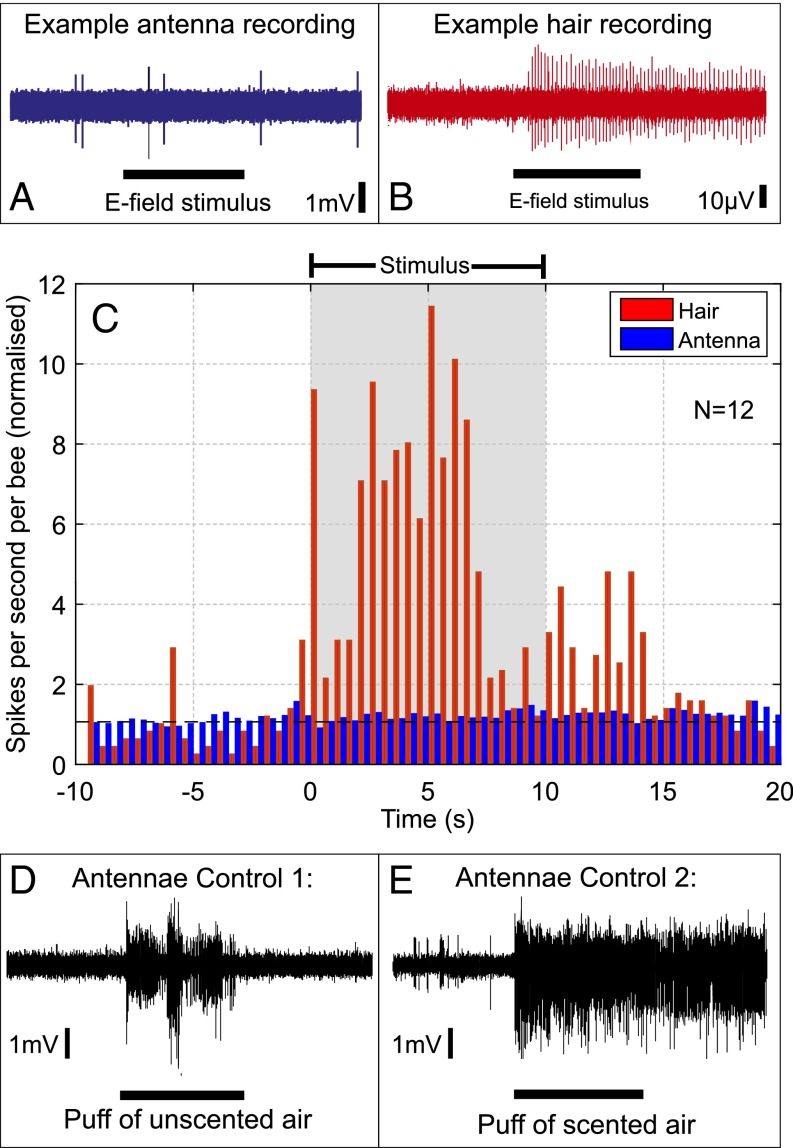
Fig. 6.
The electrophysiological response to an electric field. (A and B) Example response of an antenna (blue) and a hair (red) to an electric field. (C) Plot showing the observed changes in firing rate of 12 antennae (blue) and 12 hairs (red) to an electric field stimulus (applied during the gray box). The value shown is the number of spikes per second, per bee, divided by the mean prestimulus spike rate. A value of 1 (dashed black line) indicates no change in spike rate. (D and E) Two control stimuli applied to the antenna: Puffs of unscented air (D) and a puff of scented air (E) demonstrate the lack of response of the antenna seen in A is not due to damage during the dissection.

