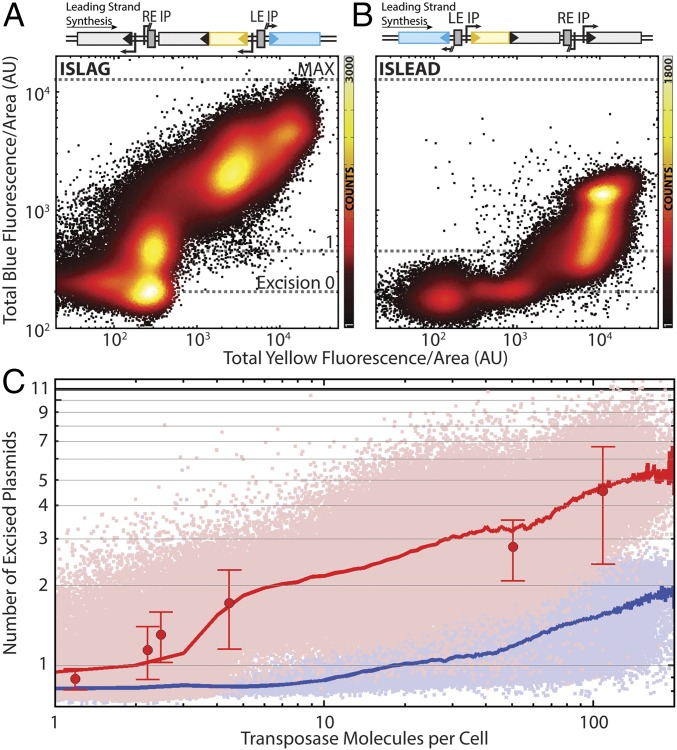
Fig. 2.
TE excision response function. Scatterplots of blue vs. yellow total cellular fluorescence divided by cell area for TE encoded in the (A) lagging (Ncells = 192,965) and (B) leading (Ncells = 101,709) strand of the host plasmid. Colors indicate number of counts in each bin of a 500 × 500 grid covering the data. (C) The same data as in A and B with absolute axes. The y axis is expressed in terms of the absolute number of excised plasmids, and the x axis is scaled to absolute number of transposase molecules per cell. Light-red and -blue points are lagging and leading strand data from A and B, respectively. Red and blue lines are excised plasmid number averaged according to transposase molecules binned as integer quantities. Large red points indicate the number of excised plasmids as measured by qPCR; error bars are the SEM of three experimental replicates. See also Fig. S3.

