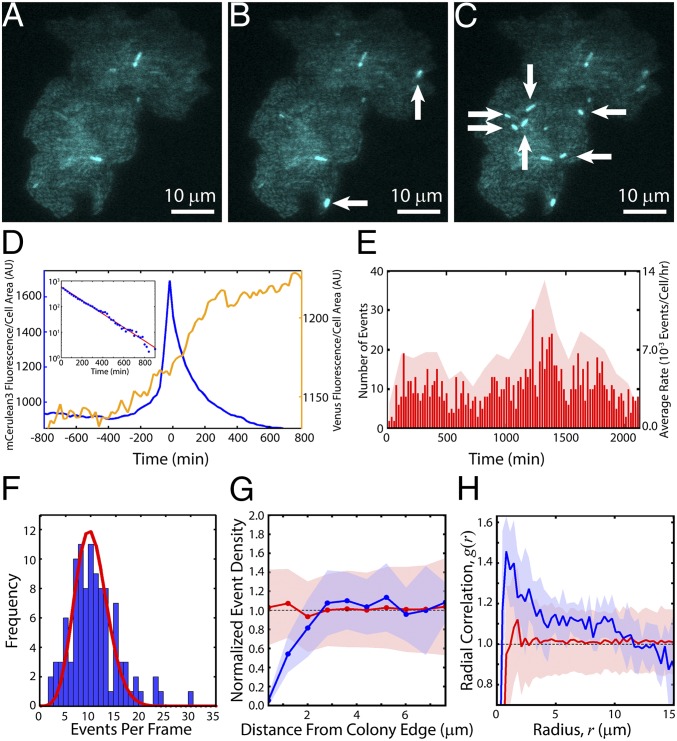
Fig. 3.
Real-time TE kinetics. Colony induced with 5 ng/mL aTc undergoing excision events at (A) t = 0 (time of first detected events, after ∼10 h of growth), (B) t = 40 min, and (C) t = 60 min. New events are indicated by white arrows. (D) mCerulean3 and Venus-TnpA traces for an average event. TE events were aligned with peak mCerulean3 intensity at t = 0. Shown is the mean mCerulean3 (blue, left y axis) and Venus-TnpA (yellow, right y axis) fluorescence per cell area as a function of time averaged over 773 events. (Inset) Decay of mCerulean3 fluorescence as a function of time. Red line is a fit to an exponential , with A = 589 and b = −0.006 min−1, consistent with photobleaching. (E) Raster plot of all events in a single experiment (red lines, left y axis) with t = 0; Ncolonies = 12, Ncells = 4,858, Nevents = 1,114. The average rate was 6.3 ± 2.6 × 10⁻³ events per cell per hour. Red shaded region shows the average rates during 100-min intervals (right y axis). (F) Blue bars: frequency of the number of events per frame. Red line: distribution of events per frame expected from a Poisson process with an average rate of 6.3 × 10⁻³ events per cell per hour. (G) Within each colony, we determine the event densities within annuli of width 0.8 μm at various distances from the colony edge (Fig. S7). We then took an ensemble average over all colonies, where the density in each colony is normalized by the mean event density over the entire colony. Blue line: mean normalized density of events in 0.8-μm-wide annuli vs. the distance of the center of each annulus from the colony edge; shaded blue region is the SD. Red line: mean normalized density obtained from simulations of randomly spaced events; shaded red region is the SD. (H) Blue line: mean pair correlation function, g(r), of events; shaded blue region is the SD. Red line: g(r) of randomly spaced events obtained from simulations; shaded red region is the SD.

