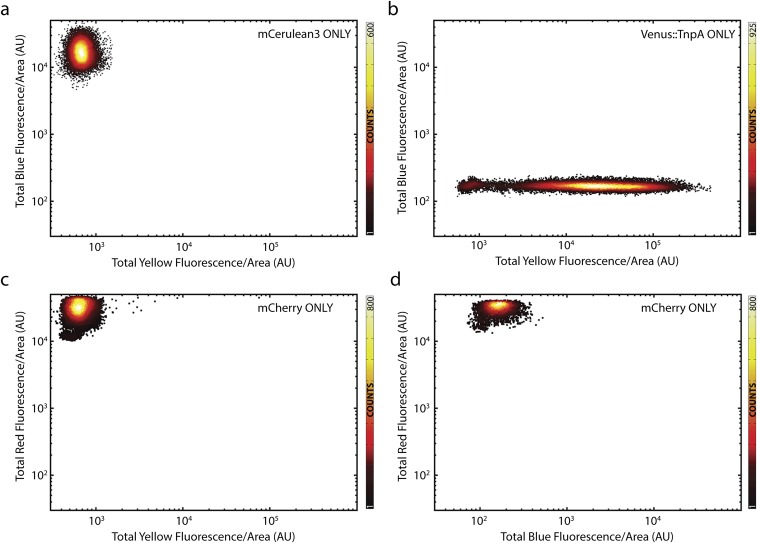
Fig. S1.
No cross-talk between fluorescent channels. (A and B) Scatterplots of blue vs. yellow fluorescence for controls expressing only (A) mCerulean3 (n = 17,137 cells) and (B) titration of Venus-TnpA (n = 65,791 cells) with [aTc] ∈ [0, 100] ng/mL. (C and D) Scatterplots of (C) red vs. yellow (n = 31,376 cells) and (D) red vs. blue fluorescence (n = 21,125 cells) of a strain expressing only mCherry.

