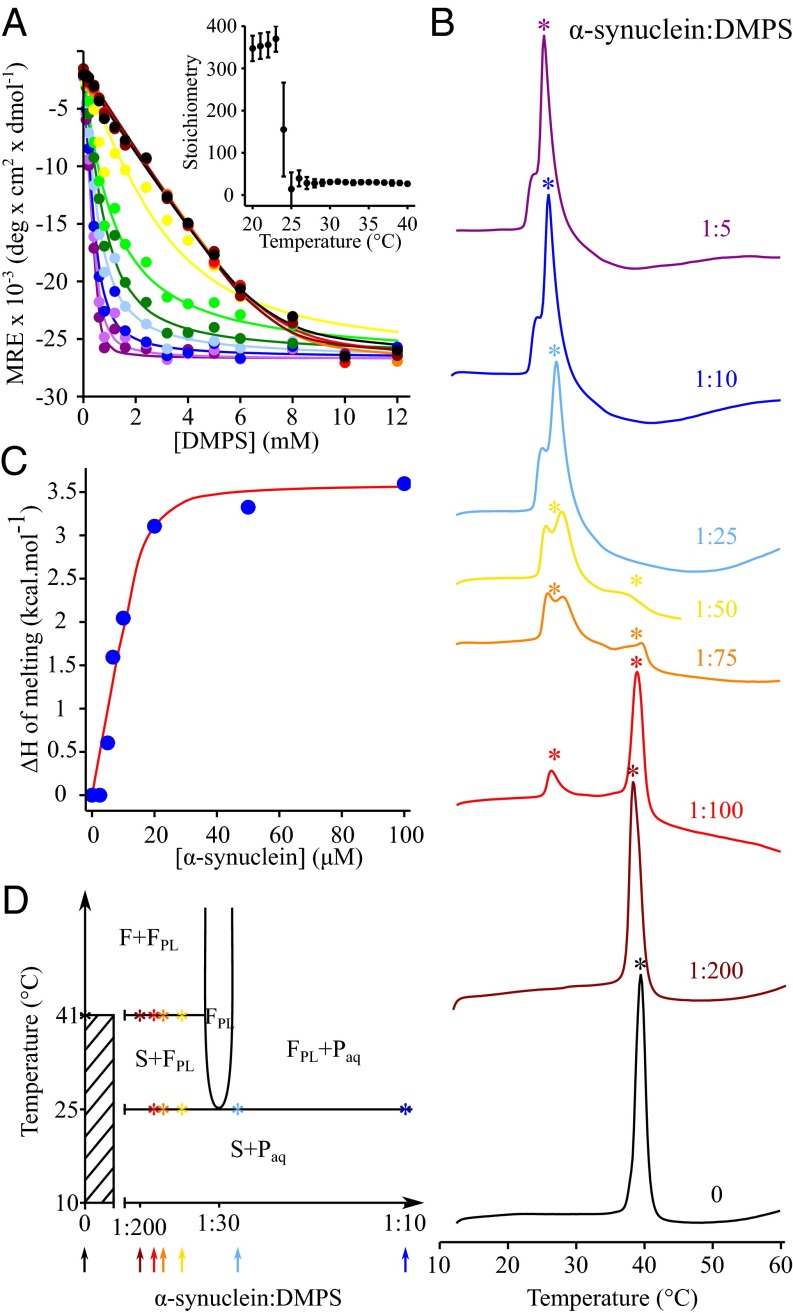
Fig. 1.
The interplay between the properties of DMPS model membranes and the lipid-binding properties of α-synuclein at different temperatures. (A) Change in the mean residue ellipticity (MRE) measured at 222 nm of α-synuclein (20 μM) incubated in the presence of increasing concentrations of DMPS at 20 °C (black), 21 °C (dark red), 22 °C (red), 23 °C (orange), 24 °C (yellow), 25 °C (light green), 26 °C (green), 27 °C (light blue), 28 °C (dark blue), 29 °C (light purple), and 30 °C (dark purple). (Inset) Change in the stoichiometry, the number of DMPS molecules associated with one molecule of α-synuclein (L), with temperature. (B) DSC thermograms of 500 μM DMPS in the absence (black) and the presence of 2.5 μM (dark red), 5 μM (red), 6.7 μM (orange), 10 μM (yellow), 20 μM (light blue), 50 μM (dark blue), and 100 μM α-synuclein (dark purple). (C) Variation of the enthalpy of the transition at 25 °C with increasing concentration of α-synuclein. The experimental values of the change in enthalpy (filled blue circles) were determined by integrating the area below the transition at 25 °C and were then fitted (red line) to a one-step binding model using SI Appendix, Eq. S5 (see the SI Appendix for details). (D) Proposed phase diagram for the DMPS-protein bilayer phases in an excess aqueous solution (that is metastable for at least 1 h against aggregation). The x axis refers to the total composition of the sample (bilayer phases + excess solution), and the composition of the bilayer phase can be determined from the CD data (Fig. 1A). Asterisks indicate the temperatures at which the melting transition(s) were observed in the DSC thermograms measured at different P:L ratios. The solid lines are based on the DSC and CD experimental data together with thermodynamic consideration to fulfill the Gibbs phase rule (35). The phase diagram does not account for the partitioning of the excess peptide between the aqueous solution and the lipid phases. F and S refer to the liquid crystalline and solid gel lamellar phases, respectively. FPL refers to the fluid protein–lipid phase. The protein monomer in solution is referred to as Paq. In addition, the diagram does not account for the splitting of the excess heat capacity peak at ∼25 °C in the DSC traces because we cannot distinguish the different enthalpic contributions related to protein adsorption, protein conformational change, and lipid melting that may occur simultaneously or sequentially.

