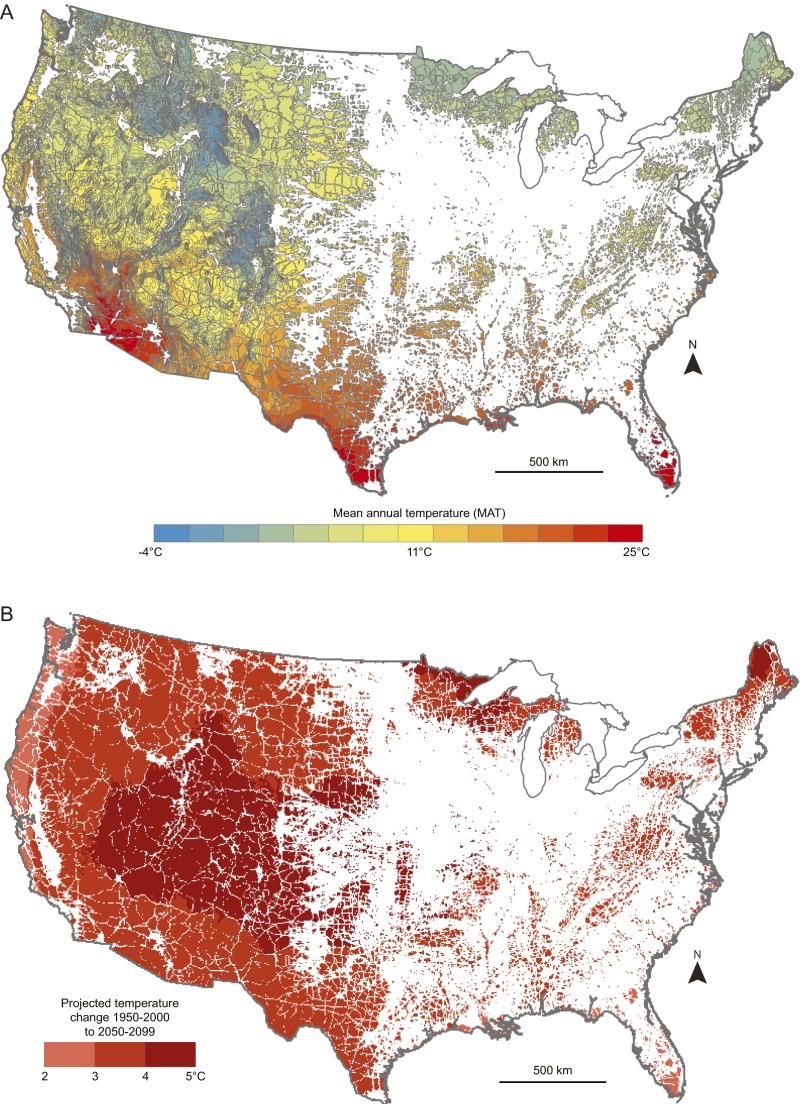
Fig. S2.
Climate maps. (A) Final climate-partitioned, natural patches. (B) One hundred-year change in patch temperature. This map displays the difference between current (1950–2000) and future (2050–2099) temperatures. Temperatures are based on the mean ensemble of 15 climate projection models (19). Future models use the A2 emissions scenario (18).

