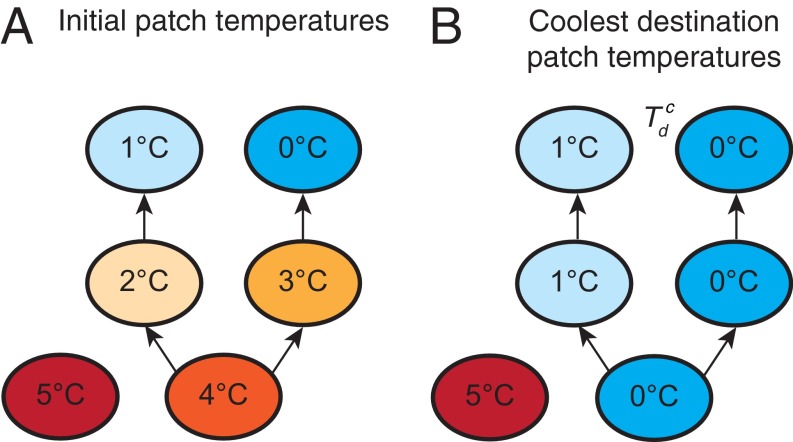
Fig. S3.
Theoretical network of patches, demonstrating the calculation of coolest destination patch temperatures (). Each oval represents a patch. The colors and temperatures within each oval represent the initial temperature (A) or the destination temperature (B). Movement is in the direction of the arrows, from hotter to cooler patches. (A) Program examines each patch in turn, going from the coolest patch to the hottest patch. (B) It determines whether that patch connects to a cooler patch, selects the coolest connected patch if it connects to multiple patches, and assigns the patch a destination temperature. Unconnected patches, such as the 5 °C patch, retain their initial temperatures, as shown in A and B.

