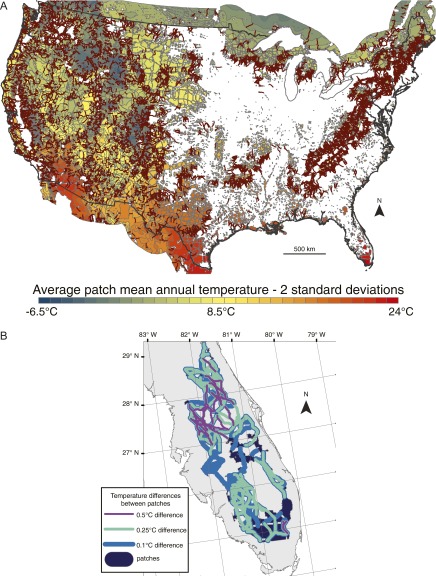
Fig. S6.
Climate-gradient corridor sensitivity tests. (A) Climate-gradient corridor map that demonstrates the need to revise the default method (20) for designating temperature differences between patches. The map requires a 1 °C difference in minimum patch temperatures. Dark-red lines are least-cost climate gradient corridors. Note that many patches, particularly in Florida, Texas, and the Midwest, are isolated, without corridor connections or adjacent patches. (B) Florida sensitivity map of temperature differences between patches.

