Fig. 2.
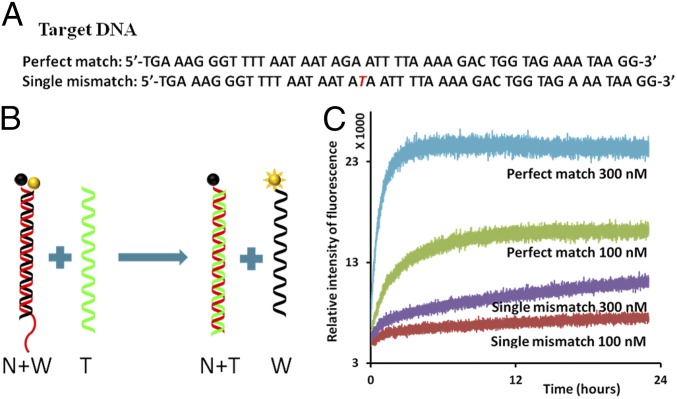
Single-mismatch detection using fluorescently labeled nucleotides. (A) Sequences of the target DNA. (A, Top) Perfect match. (A, Bottom) Single mismatch. The mismatched nucleotide is marked in red. (B) Schematics of strand displacement: nucleotide with fluorophores (yellow ball) and nucleotide with quencher (black ball). Initially, the normal (N) (red) and weak (W) (black) strands are hybridized; fluorophore (yellow ball) and quencher (black ball) are adjacent so that fluorescence is quenched. When the green strand (perfect-match T) interacts with DS probe, strand displacement takes place, and the normal strand (N) and perfect-match target strand hybridize. The weak strand (W) remains single-stranded, and the fluorophore becomes active. (C) Real-time fluorescence measurement of the strand displacement. Interaction of the single-mismatch target strand with DS probe shows much less fluorescence activity than the interaction of the perfect match with DS probe. The concentration of DS probe was 10 nM, and the concentrations of T strands varied from 100 to 300 nM, shown under each plot.

