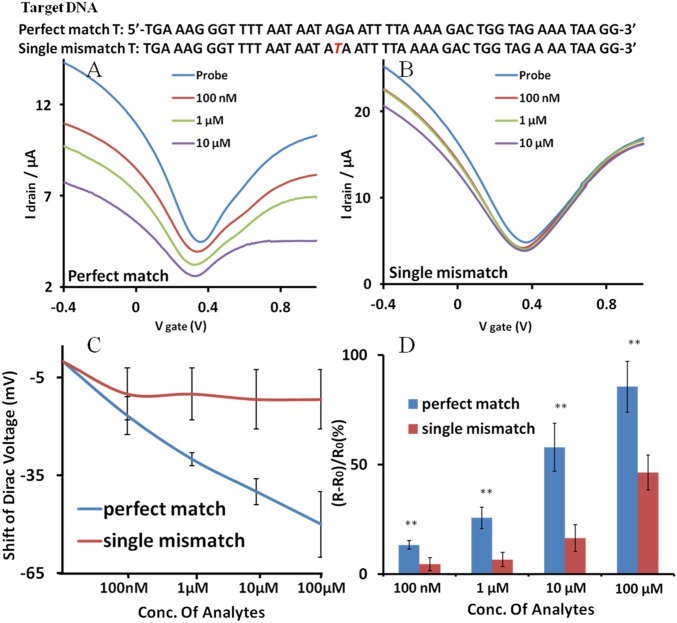
Fig. 4.
I-V relationship of the graphene FET sensor for the strand displacement reactions. (A) The perfect-match T shifted the I-V curve according to the indicated concentrations. (B) The single-mismatch T shifts the I-V curve significantly less. The DNA sequences of T used in the experiments are shown over the I-V curve. (C) Dirac voltage shift of the FET sensor. The Dirac voltage is expressed as a function of the concentration of the added target DNAs. (D) Distinguishable resistance change of the channel layer caused by strand displacement at different concentrations of the T DNAs. Statistical values (means ± SD) were based on three sets of independent data points (n = 3). **P < 0.01. Conc, concentration.

