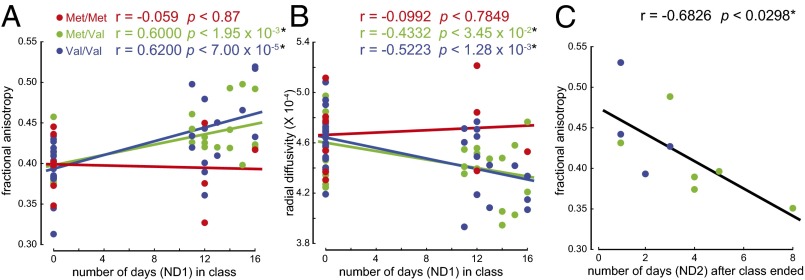
Fig. 2.
Relationship between immersion and white matter brain structure differed with COMT genotype. (A) Subjects with Met/Val and Val/Val genotypes showed a significant positive correlation between the FA values in the SLF and number of days each subject had been in the class at the time of brain scan (ND1), whereas Met/Met subjects did not (P < 0.872 for Met/Met genotype; P < 1.95 × 10⁻³ for Met/Val genotype; and P < 7 × 10⁻⁵ for Val/Val genotype). (B) Subjects with Met/Val and Val/Val genotypes showed a significant negative relationship between the RD values in the SLF and ND1 (P < 0.7849 for Met/Met genotype; P < 3.45 × 10⁻² for Met/Val genotype; and P < 1.28 × 10⁻³ for Val/Val genotype). (C) Subjects with the Met/Val and Val/Val genotypes showed a significant negative relationship in FA values in the SLF with number of days after the class ended (ND2) (P < 0.0298).

