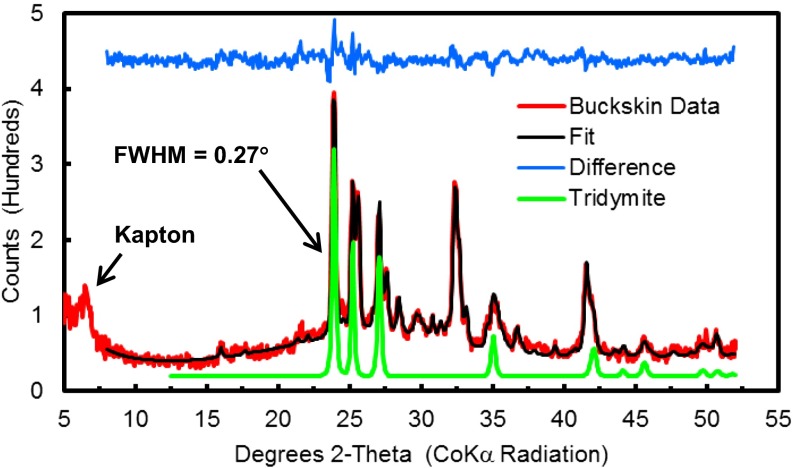
Fig. 2.
Buckskin diffraction pattern (red) from sum of first four diffraction images, calculated pattern from Rietveld analysis (black), difference pattern (blue), and refined tridymite pattern (offset green); see SI Appendix, Fig. S4 for refined patterns of all minerals. Full width at half maximum intensity (FWHM) of the tridymite peak at 23.9° 2θ is 0.27° 2θ, which corresponds to CheMin 2θ resolution measured on Earth before launch (ref. 4, figure 18). Peak at ∼6.5° 2θ is from the Kapton cell window.

