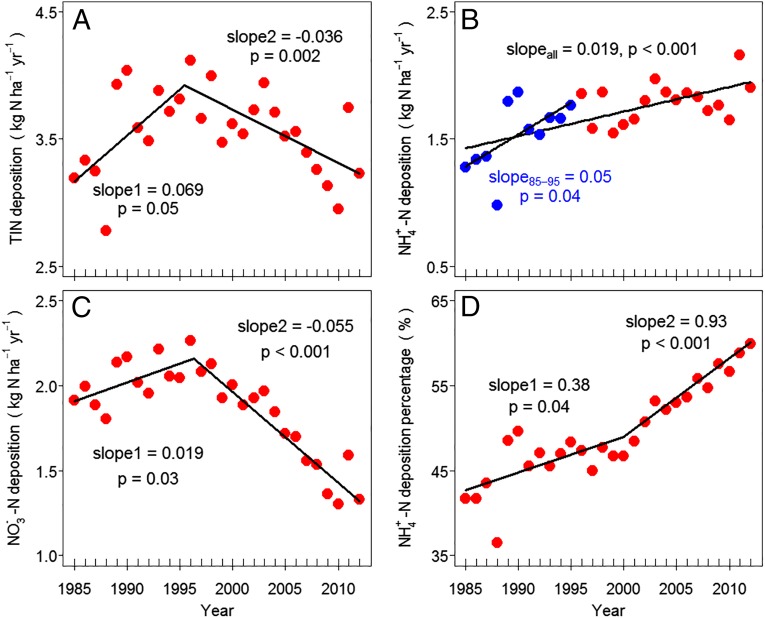
Fig. 1.
Changes in national mean wet deposition (unit: kg N ha−1 yr−1) of (A) total inorganic N (TIN), (B) ammonium (NH4+), (C) nitrate (NO3−), and (D) ammonium percentage of wet inorganic N deposition in the United States between 1985 and 2012. Observed data of wet deposition were available from National Atmospheric Deposition Program (nadp.sws.uiuc.edu/). Sites were excluded if data were missing for 1 or more years and totally 151 sites were used in this analysis. The piecewise linear regression analysis was conducted by using the “segmented” package (5) for R software.

