Fig. 3.
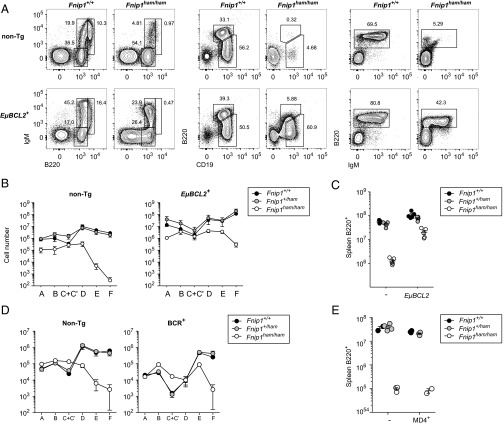
Partial rescue of early B-cell development by an EμBCL2 transgene but not a BCR transgene. (A) Flow-cytometric plots of major B-cell populations in bone marrow (Left), peritoneum (Center), and spleen (Right) of wild-type and Fnip1 mutant mice with or without an EμBCL2 transgene. (B and D) Absolute numbers of cells in corresponding Hardy fractions (A, B220+CD43+BP-1−CD24−; B, B220+CD43+BP-1−CD24+; C+C′, B220+CD43+BP-1+CD24+; D, B220+CD43−IgM−IgD−; E, B220+CD43−IgM−IgD+; and F, B220+CD43−IgM+IgD+) in the presence or absence of an EμBCL2 or BCR transgene. (C and E) Absolute numbers of B220+ splenocytes. Plots in A are representative of five mice per genotype. Symbols in B and D represent the means (± SEM). Each symbol in C and E represents an individual mouse. Bars indicate means ± SEM.

