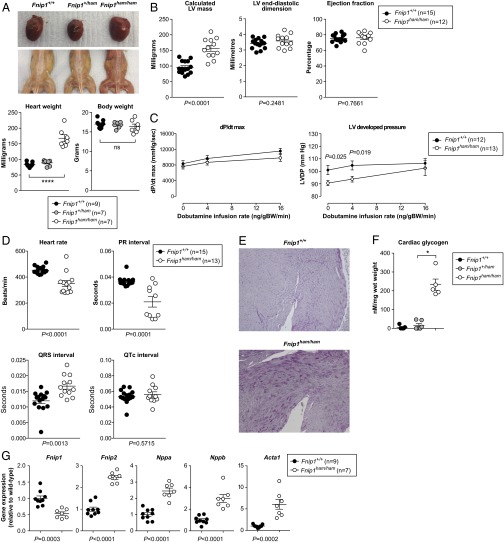
Fig. 4.
Cardiac phenotype associated with the Fnip1 mutation. (A) Macroscopic appearance of heart and skeletal muscle of adult wild-type and Fnip1 mutant mice. Heart and body weight of 6-wk-old female mice are represented in the lower image. (B) Calculated LV mass, LV end-diastolic dimension (LVEDD), and LV ejection fraction. (C) Invasive hemodynamic measurements of LV dP/dt max, and LV developed pressure (LV systolic pressure – LV end-diastolic pressure) at baseline and in response to dobutamine stimulation in vivo. (D) Heart rate, PR, QRS, and corrected QT (QTc) intervals of 20-wk-old wild-type and Fnip1 mutant mice under isoflurane anesthesia. P values calculated by unpaired two-tailed t test. (E) Periodic acid–Schiff staining of LV myocardium (100× magnification). (F) Cardiac glycogen content. (G) Cardiac expression of Fnip1, Fnip2, and selected gene markers of cardiac stress. Symbols represent individual mice (A, B, D, F, and G) or the mean (C), with all error bars indicating means ± SEM. P values calculated by unpaired two-tailed t test (B–D and G) or one-way ANOVA with Bonferroni posttest (A and F). *Significance at α = 0.05.

