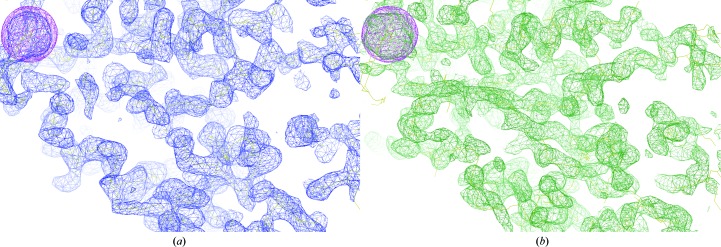
Figure 4.
Comparison of the experimental electron-density maps from SOLOMON (a) and RESOLVE (b) contoured at 1σ. The SOLOMON solvent-flattened electron-density map was calculated at 4 Å resolution and allowed the identification of clear protein and solvent boundaries. Secondary-structure elements are readily interpretable in the 2.9 Å resolution RESOLVE solvent-flattened and NCS-averaged map. The map skeleton is shown (in yellow) to highlight map connectivity in both figures. The anomalous substructure map in magenta (contoured at 3σ) indicates the location of Ta6Br12 clusters.

