Figure 7.

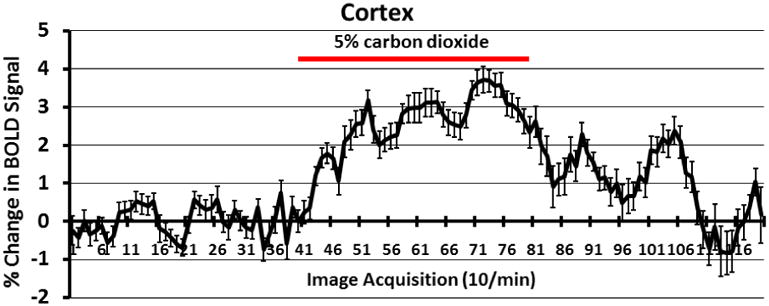
Shown is a time-course plot (n = 6) for the change in BOLD signal in the cortical mantel in response to a 4 min exposure to 5% CO2 (red line). Shown are the mean and standard error for each time point.

Shown is a time-course plot (n = 6) for the change in BOLD signal in the cortical mantel in response to a 4 min exposure to 5% CO2 (red line). Shown are the mean and standard error for each time point.