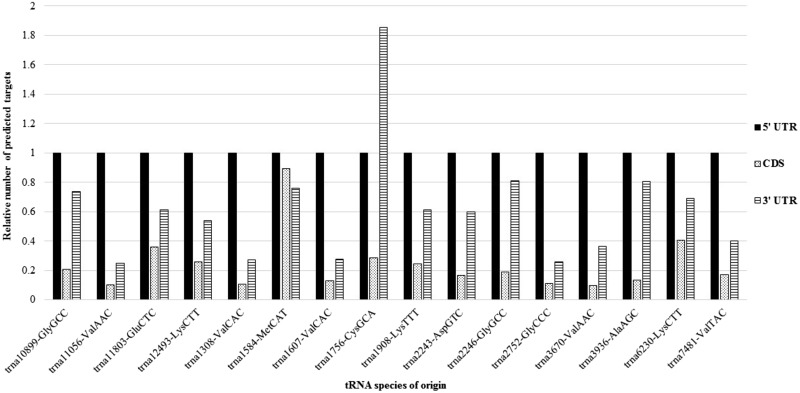
Figure 2.
Relative numbers of predicted 5′ halve gene targets in 5′ UTR, CDS, and 3′ UTR sequences. The number of predicted gene targets for each differentially expressed 5′ halve species within the 5′ UTR, CDS, and 3′ UTR was normalized to the number of targets within the 5′ UTR, for each 5′ halve species. Relative to CDS and 3′ UTR, 5′ UTR sequences had the highest incidence of RNAhybrid predicted 5′ halve binding sites. A P -value ≤0.01 was used as a cutoff

