
Figure 5. Immunofluorescence of perivascular nerves .
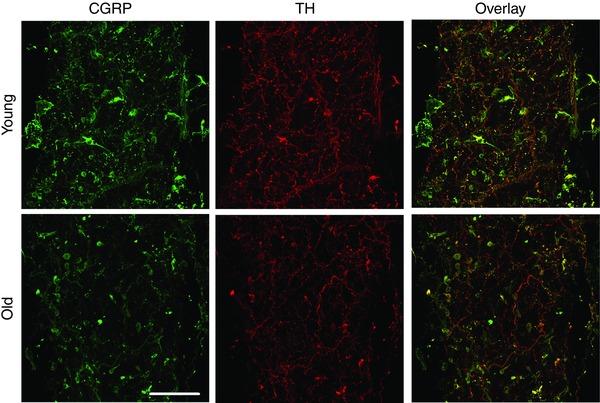
Images are representative maximum Z‐projections of MAs double‐stained for both sensory nerves (left panels, labelled for CGRP) and sympathetic nerves (centre panels, labelled for tyrosine hydroxylase, TH) from Young (top row) and Old MAs (bottom row). Right panels are overlays of the fluorescence from respective images. Scale bar = 100 μm and applies to all panels. Images are representative of n = 9–16 MAs from 4–5 mice per age group.