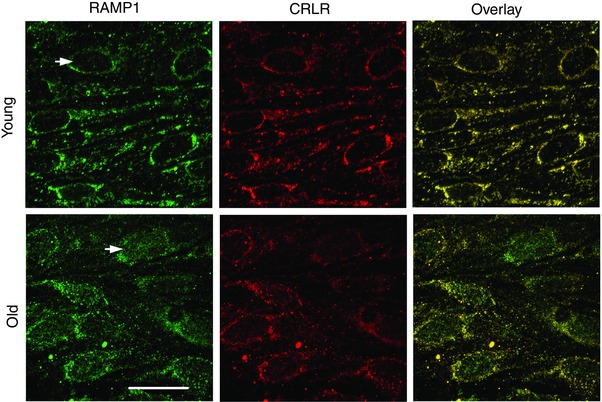
Figure 7. Nuclear association of RAMP1 with endothelial cell nuclei of Old but not Young MAs .

Images are maximum Z‐projections double‐stained for RAMP1 and CRLR. Panels at right are overlays; yellow indicates correspondence in localisation of respective CGRP receptor proteins and is most consistent in endothelium of Young MAs. Staining for RAMP1 is associated with endothelial cell nuclei of Old MAs that is not present in Young MAs (arrows). Scale bar = 20 μm and applies to all panels. Representative of n = 9–12 MAs from 3 mice per age group.
