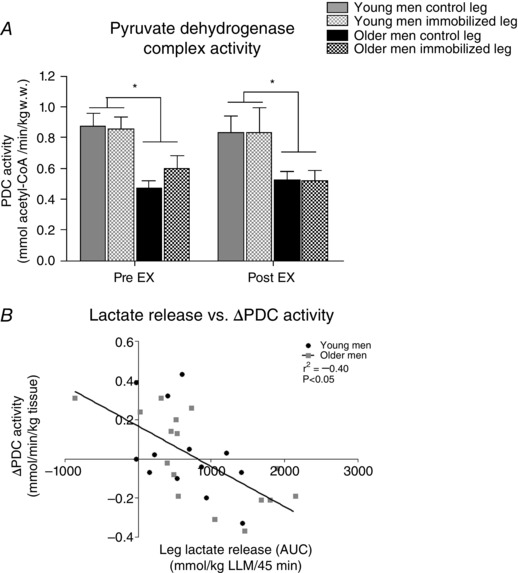
Figure 6. Pyruvate dehydrogenase complex (PDC) specific activity (A) and correlation between ∆PDC activity and area under the curve (AUC) for leg lactate release (B; Fig. 2 D) in young and older men after 2 weeks of unilateral immobilization with the other leg serving as a control .

Values were measured pre and post 45 min isolated knee‐extensor exercise (EX) at moderate intensity with both legs. *P < 0.05 young vs. older men (main effect). Data are shown as mean values + SEM.
