
FIGURE 10.
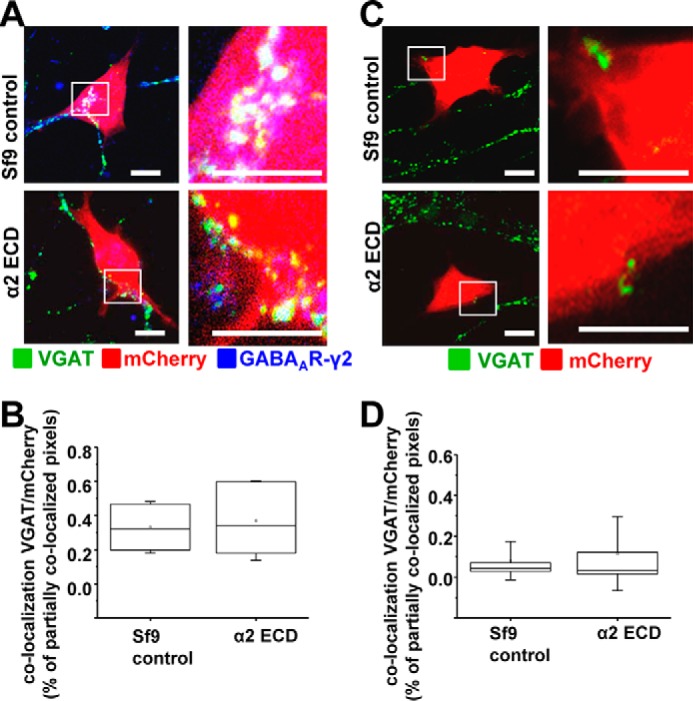
Purified N-terminal ECD of the α2 subunit does not inhibit the formation of synaptic contacts between MSNs and α1β2γ2-HEK293 cells. Immunolabeling is shown of synaptic contacts between GABAergic presynaptic terminals of MSNs expressing VGAT and α1β2γ2-HEK293 cells (A) or control HEK293 cells (C) in the presence of control Sf9 cell extracts (top panel) or purified α2 N-terminal ECD (lower panel). GABAergic terminals were labeled with an anti-VGAT antibody (in green); HEK293 cells were labeled with mCherry (in red), and the surface expressed GABAARs were labeled with a γ2 subunit-specific antibody (in blue). A selected area in each image (left column, white box) was magnified four times, and these images were included in the right column. Scale bar, 10 μm. Quantification of contacts is shown between MSNs and α1β2γ2-HEK293 cells (B) or control HEK293 cells (D) in the presence of control Sf9 cell extracts or purified α2 N-terminal ECD, expressed as a percentage of co-localized pixels between VGAT-positive MSN terminals and mCherry-expressing HEK293 cells. The data were initially analyzed using the Shapiro-Wilk and Kolmogorov-Smirnov test and subsequently using the non-parametric Mann-Whitney test with a confidence interval of 95%. The box plots display the median and IQR; small squares represent the mean, and whiskers represent the data range within 1 S.D. of the median (α1β2γ2-HEK293: n = 18 cells from n = 2 independent experiments; HEK293: n = 17 cells from n = 2 independent experiments).