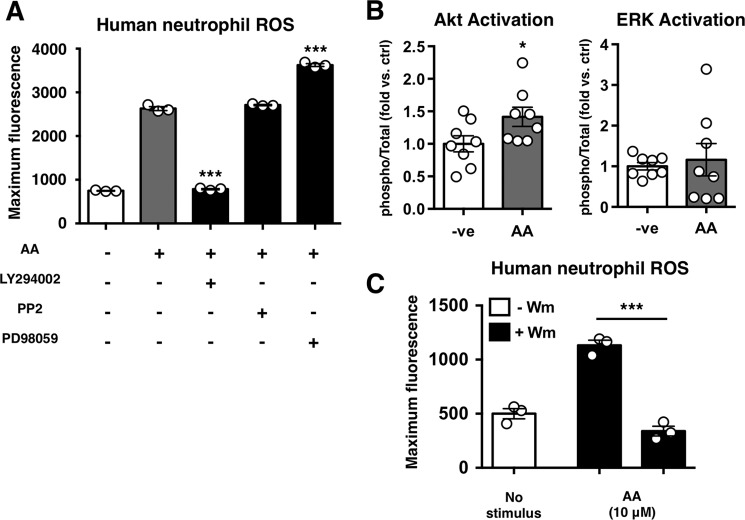
FIGURE 6.
Anacardic acid signals through PI3K. A, anacardic acid stimulated ROS production in the presence of inhibitors of PI3K (LY294002; 10 μm), Src (PP2; 100 nm), or MEK (PD98059; 50 μm). Representative experiment is shown of three independent experiments performed in triplicate. B, results of total/phospho-Akt/ERK ELISAs showing fold change in the total/phospho-Akt/ERK ratio versus control (n = 8). C, anacardic acid- and PMA-stimulated ROS production in the presence of the PI3K inhibitor wortmannin (Wm; 10 μm) (n = 3). Unless otherwise noted, data shown are expressed as mean values ± S.E. of at least three independent experiments. Where applicable, the results were analyzed by one-way analysis of variance and post hoc Newman Keuls test. *, p < 0.05; ***, p < 0.001 versus control values.

