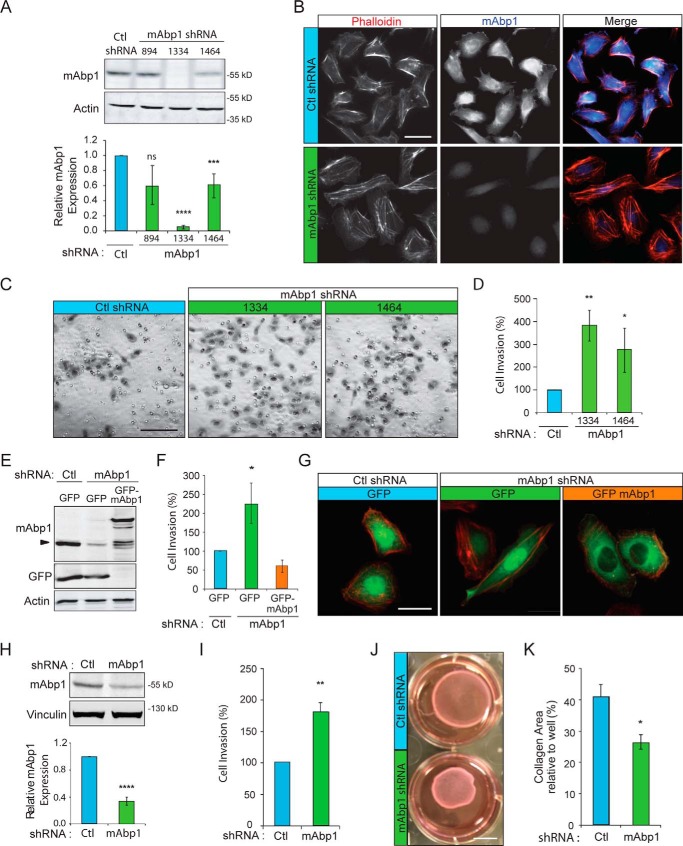
FIGURE 1.
mAbp1 inhibits invasion of MTLn3 and MDA-MB-231 breast cancer cells. A, control and mAbp1 shRNA stable lines were generated by retroviral transduction of MTLn3 breast cancer cells; target nucleotide sites are noted. Western blot of cell lysates was probed for endogenous mAbp1 and actin as a loading control. Densitometry analysis of mAbp1 expression relative to actin and normalized to control is shown. n = 8; ***, p = 0.0010; ****, p < 0.0001. ns, not significant. B, mAbp1 immunofluorescence and rhodamine phalloidin (actin) staining of fixed control and 1334 shRNA cells cultured on gelatin and fibronectin-coated coverslips. Endogenous mAbp1 localizes to cytoplasm, perinuclear region, and in lamellipodia. Scale bar = 20 μm. C, invasive migration of control or mAbp1 knockdown lines (1334 and 1464). Cells were serum-starved for 24 h, then seeded in Matrigel-coated boyden chambers and allowed to invade toward serum-containing media for 16 h. Invaded cells were stained, imaged with 20× objective, and counted. Scale bar = 100 μm. D, quantification of cell invasion. Percentage of cells invaded relative to control from 12 images taken at 20× magnification. Four independent experiments. **, p = 0.0068; *, p = 0.0462. E, expression of GFP or GFP-mAbp1 in control or mAbp1 shRNA MTLn3 cells. Shown in a Western blot probed for mAbp1, GFP, and actin as a loading control. F, cells transiently transfected with GFP or GFP-mAbp1 were serum-starved for 24 h after transfection, then seeded on Matrigel-coated boyden chambers and allowed to invade toward serum for 16 h. Percentage of cells invaded relative to control from 12 images taken at 20× magnification. Data are from three independent experiments. *, p = 0.0116. G, fluorescent images of GFP or GFP-mAbp1 expression in transiently transfected control or mAbp1 shRNA cells, fixed, and stained with rhodamine phalloidin (actin). GFP-mAbp1 localizes to focal adhesions similar to endogenous mAbp1. Scale bar = 20 μm. H, stable control and mAbp1 knockdown MDA-MB-231 cell lines were generated by retroviral transduction of shRNA. Shown is a Western blot of cell lysates probed for endogenous mAbp1 and vinculin as a loading control. Densitometry analysis of mAbp1 levels relative to control is shown. n = 9; ****, p < 0.0001. I, quantification of invasion between control or mAbp1 shRNA MDA-MB-231 cells through Matrigel-coated boyden chambers. Cells were serum-starved 24 h, seeded on Matrigel, and allowed to invade toward serum media for 48 h. Percentage of cells invaded relative to control from 12 images were taken at 20× magnification. The experiment was performed in quadruplicate. **, p = 0.0069. J, control and mAbp1 shRNA MDA-MB-231 cells were cultured in 1 mg/ml collagen and floated in media to allow for collagen contraction to occur for 48 h. Scale bar = 1 cm. K, quantification of the percentage of contracted collagen area relative to total area. n = 4; *, p = 0.0164. Error bars represent the S.E.

