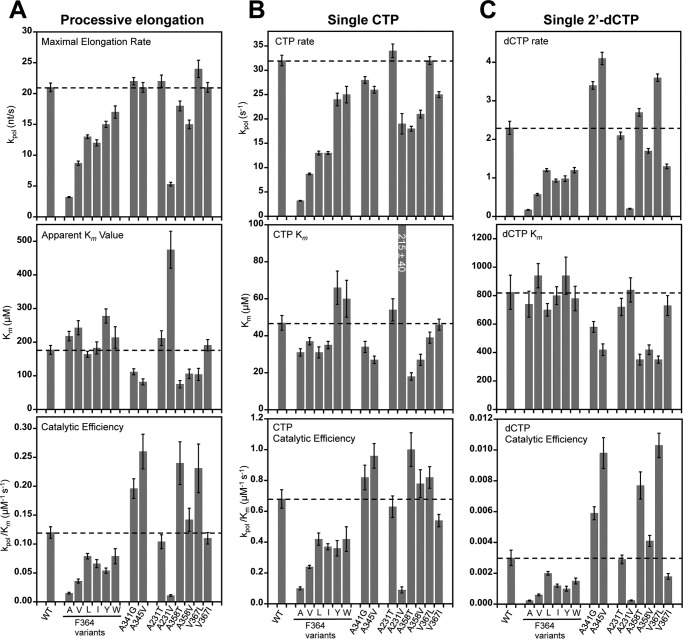
FIGURE 4.
Summary of processive and single nucleotide elongation data. A, plots of processive elongation rates (kpol; top), Km values (middle), and catalytic efficiencies (kpol/Km; bottom) for all mutations in this study. Dashed horizontal lines indicate WT values, and error bars reflect the S.E. obtained from curve fitting the data. For the catalytic efficiencies, these errors are propagated as root mean square fractional errors. B and C, analogous plots for single nucleotide turnover rates with CTP and 2′-dCTP substrates. nt, nucleotides.

