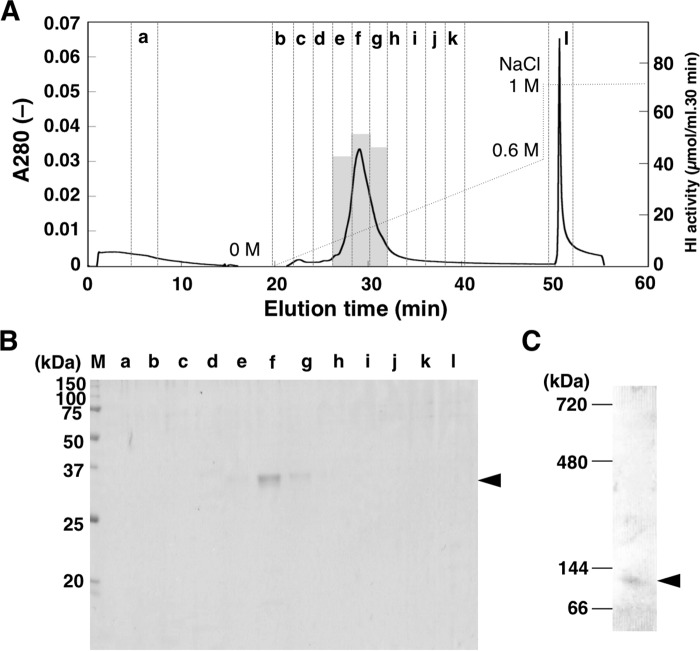
FIGURE 2.
Purification of CaHI from paprika pericarp. A, elution profile of CaHI in the final step of purification. HI activity in fractions containing proteins was measured by standard assay. Activity is shown by a gray bar. B, protein profile in each fraction (small letters are as in panel A; M, molecular marker) was analyzed by SDS-PAGE. C, molecular mass of native HI was determined by BN-PAGE. Arrowheads indicate bands of purified CaHI.

