
FIGURE 4.
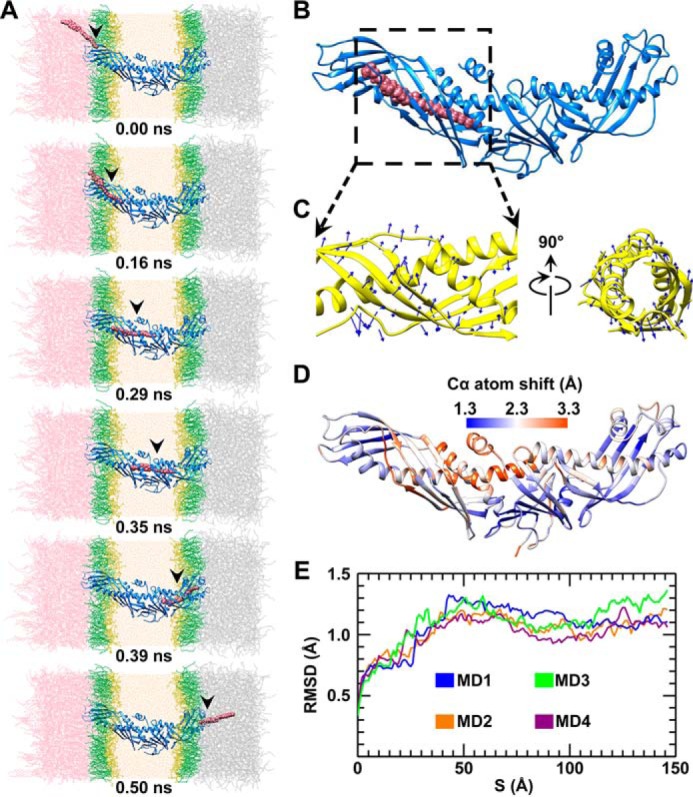
CE transfer through the CETP molecule through all-atom steered molecular dynamics simulations. A, snapshots of a CE molecule (shown in van der Waals spheres) during transfer through a CETP molecule (shown in ribbon) under a representative force of 11 kcal/mol/Å. The POPC headgroups and fatty tails are colored yellow and green, respectively, and the CE, TG, CETP, and water molecules are colored pink, gray, blue, and orange, respectively. Shown is a representative snapshot image of CETP when the CE molecule was in the middle of the N-terminal β-barrel domain (B), leading to the rotation of the N-terminal β-barrel domain (C, blue arrows). D, each residue shifts from its original position during CE transfer. For each Cα atom, the maximum shift from four simulations was averaged and colored on the CETP structure (the color and value relationship are shown as a color bar). E, CE transfer through CETP was simulated four times under the representative force of 11 kcal/mol/Å. The RMSD from each simulation versus the CE position along the CE transfer pathway is shown.