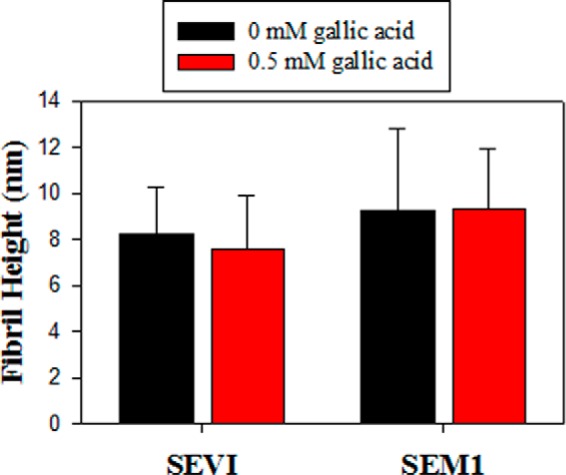
FIGURE 5.

Structural morphology of fibrils in the absence and presence of 0.5 mm gallic acid. Fibril heights were measured from AFM images using Igor Pro MFP3D software. A line was drawn across individual fibrils, and a two-dimensional trace of the image surface was generated and used to determine fibril height. At least three images were analyzed for each condition (>150 measurements). The average fibril height is reported, and error bars represent S.D. values in fibril height.
