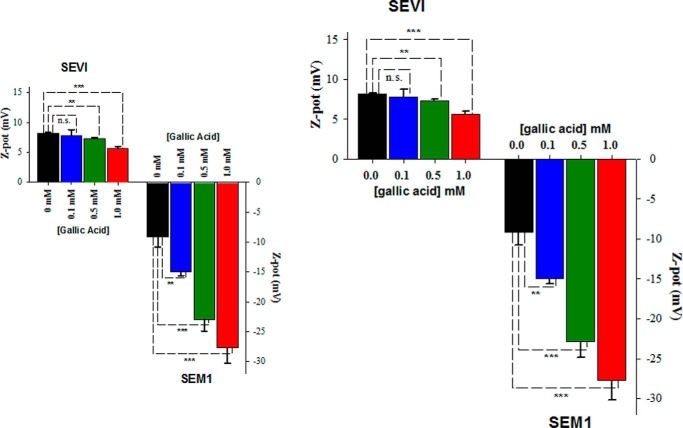
FIGURE 8.
Zeta potential of SEVI (left) and SEM1 (right) fibrils in the presence of increasing concentrations of gallic acid. Fibrils were preformed in PBS at pH 7.7 and then resuspended in PB for zeta potential measurements. Averaged values and S.D. values (error bars) of triplicate experiments for each data point are shown. **, p < 0.01; ***, p < 0.001, Student's t test. n.s., not significant.

